Category Archives: DBA

All about In-Memory isolation levels, Part 2

In the Part 1, we covered the basics of transaction initiation modes and isolation levels. Today we’ll continue with more details about isolation levels and initiation modes for memory-optimized tables, and finally we’ll see how to reference both types of tables in a query.

But first, let’s summarize supported isolation levels.

List 1:

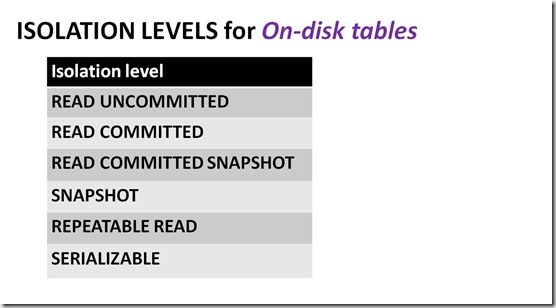
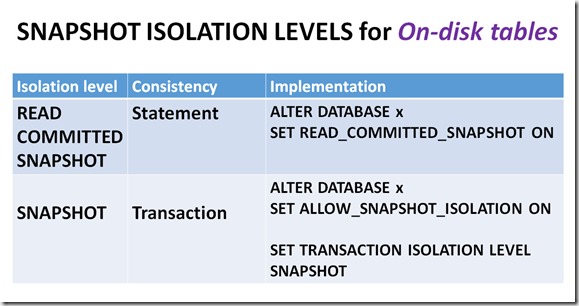
OnDiskIsolation_thumb4

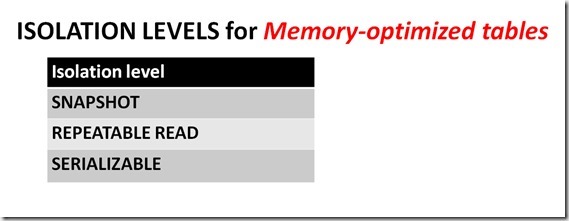
Last time, we had this for “List 2”:

InMemIsolation_thumb1

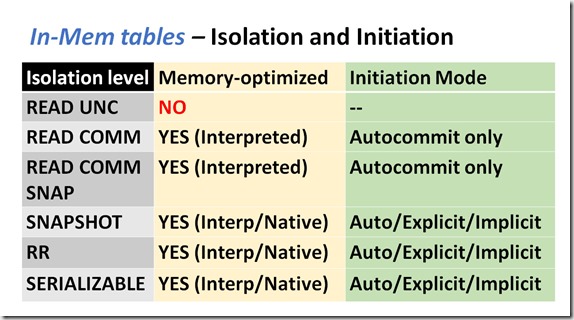
But that’s not the whole truth – the complete picture of isolation levels and initiation modes for memory-optimized tables is summarized in the following table:

InMemComplete

In Part 1, we said that READ COMMITED is supported for memory-optimized tables, but we didn’t explain how. Here we can see that it’s supported, but only for single statement, “autocommit” transactions. Autocommit transactions are not possible within a native module, so you’re limited to interpreted TSQL (un-compiled), as indicated in the table above.

Let’s work through an example.

If the transaction isolation level is set to READ COMMITED SNAPSHOT – which, as detailed in the last post, can only be set with an ALTER DATBASE command – then you can execute the following:

That’s a single statement that will be autocommitted.

But you cannot execute the following:

Why will it fail?

It will fail because the initiation mode of this transaction is not autocommit, which is required for READ COMMITED SNAPSHOT when referencing memory-optimized tables (the initiation mode is explicit, because we explicitly defined a transaction).  So to be totally clear, for queries that only reference memory-optimized tables, we can use the READ COMMITTED or READ COMMITTED SNAPSHOT isolation levels, but the transaction initiation mode must be autocommit. Keep this in mind, because in a moment, you’ll be questioning that statement….

Now let’s put it all together and understand the rules for referencing on-disk and memory-optimized tables in the same query.

Cross-Container

A query that references both on-disk and memory-optimized tables is known as a “cross-container” transaction.

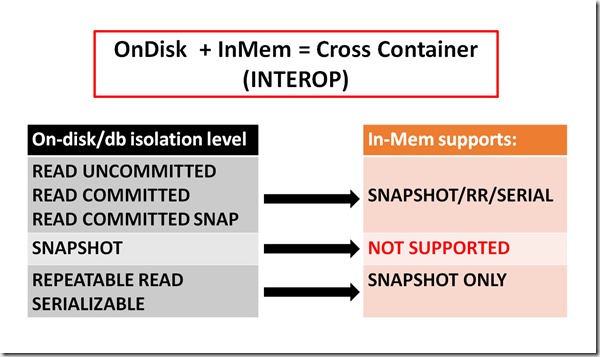
The following table lists the rules:

Interop1

If the on-disk or database isolation level is READ UNCOMMITTED, READ COMMITTED, or READ COMMITTED SNAPSHOT, then you can reference memory-optimized tables using SNAPSHOT, REPEATABLE READ, or SERIALIZABLE isolation levels. An example would be:

But wait – a moment ago we proved that when we use the READ COMMITTED isolation level, and we query a memory-optimized table, the transaction initiation mode must be autocommit. The code we just displayed uses an explicit transaction to do the same thing, so we’ve got some explaining to do….

The answer is that for queries that only reference memory-optimized tables, we must use autocommit. But the rules are different for cross-container transactions, and in that case, we can use explicit transactions.

Back to SNAPSHOT

What if we converted some tables to be memory-optimized, and they were referenced everywhere in our TSQL code?

Would we have to change all of our code to use WITH (SNAPSHOT)?

Fear not, there is a solution, and it’s a database setting known as MEMORY_OPTIMIZED_ELEVATE_TO_SNAPSHOT. If this option is enabled, then you don’t have to change your code to use WITH (SNAPSHOT) for interop statements. The engine will automagically elevate the isolation level to SNAPSHOT for all memory-optimized tables that use interop/cross-container. More information on MEMORY_OPTIMIZED_ELEVATE_TO_SNAPSHOT is available at this link.

Just to recap what we covered last time about the different forms of snapshot isolation:

  • READ COMMITTED SNAPSHOT isolation is “statement-level consistency”
  • SNAPSHOT isolation is “transaction-level consistency”

A cross-container transaction doesn’t support snapshot isolation, because it’s actually two sub-transactions, each with its own internal transaction ID and start time. As a result, it’s impossible to synchronize transaction-level consistency between on-disk and memory-optimized tables.

Wrapping up

In the first post on transaction processing, we covered isolation levels for both on-disk and memory-optimized tables, but we left out some of the details for memory-optimized tables. This post has filled in those details, and also introduced the rules for cross-container transactions.

All about In-Memory isolation levels, Part 1


Transaction initiation modes

If you want to understand the details of transaction isolation requirements for memory-optimized tables, you must first understand transaction initiation modes. That’s because the initiation mode affects what type of isolation levels are possible when referencing memory-optimized tables.

There are four different modes that describe the way in which a transaction is initiated:

Atomic Block – An atomic block is a unit of work that occurs within a natively compiled module (procedure, function, or trigger). Native modules can only reference memory-optimized tables.

Explicit – We’re all familiar with this mode, because it requires defining an explicit beginning for the transaction, and then either a commit or rollback.

Implicit – We’ll cover this mode for the sake of completeness, but I’ve not seen an implicit transaction in all my years of SQL Server. Implicit transactions require you to SET IMPLICIT_TRANSACTIONS ON, which then  – for specific types of TSQL statements – has the effect of beginning a transaction for you. It’s only benefit is that it spares you from having to write your own BEGIN TRAN statement (woo hoo).

Documentation for implicit transactions can be found here.

Autocommit – If you execute TSQL statements outside of an explicit or implicit transaction, and outside of an atomic block, then for each individual statement, the SQL Server engine starts a transaction. That transaction is automatically committed or rolled back.

An example of an autocommit transaction would be:

We did not create an explicit transaction with BEGIN TRAN, and we didn’t SET IMPLICIT_TRANSACTIONS ON, which would have allowed the engine to implicitly start a transaction. Therefore, this TSQL statement will be automatically committed or rolled back by the engine.

Isolation levels

Now that we have a basic understanding of transaction initiation modes, let’s move on to isolation levels. Isolation levels are what determine whether certain “concurrency side effects” are allowed, such as dirty reads (uncommitted data), or phantom reads. Please refer to the SQL Server documentation on isolation levels at this link or this link for specific details.

First, let’s display which types of isolation levels are available for each type of table.

List 1:

OnDiskIsolation

“Snapshot”

One thing I want to clear up right way, is how freely the word “snapshot” is used in the SQL Server documentation, the technology world in general, and how confusing this label is in the context of transaction isolation levels.

Some editions of SQL Server have the ability to create database snapshots, which use NTFS sparse files to make a “copy on write”, read-only version of a database. This type of snapshot has absolutely nothing to do with isolation levels.

The word “snapshot” is also used to describe saving the state of a virtual machine, i.e. Hyper-V, VMware, etc.

And there are also SAN snapshots, which create an image of your storage at a fixed point in time. Again, none of these types of snapshots have anything to do with isolation levels in SQL Server.

There are two variations of snapshot isolation in SQL Server:

  • statement-level consistency – Within the context of a transaction, each statement sees consistent data as of the moment the statement executed. Other transactions can modify data while your transaction is executing, potentially affecting results.
  • transaction-level consistency – All data that is referenced within the context of a transaction is guaranteed to be consistent as of the transaction start time. While your transaction is executing, modifications by other transactions cannot be seen by any statement within your transaction. When you attempt to COMMIT there can be conflicts, but we won’t cover that in this post.

Statement-level consistency is known as “read committed snapshot isolation”, while transaction-level consistency is known as “snapshot isolation”. Both can be enabled at the database level, while only transaction-level consistency can be set with the SET TRANSACTION ISOLATION command.

OnDiskSnapshot

(wrapping your brain around variations of snapshot isolation will help you understand some of the nuances in the next post)

List 2*:

(*READ COMMITTED isolation is supported for memory-optimized tables, and we’ll cover that in the next post, but for now let’s concentrate on the isolations listed here)

InMemIsolation

If you are only querying on-disk tables, you can use any of the isolations levels from List 1. And if you are only querying memory-optimized tables, you can use any of the isolation levels from List 2.

But what if you want to reference both on-disk and memory-optimized tables in the same query? Of course, the answer is “it depends”, with transaction initiation modes and isolation levels being the components of that dependency.

As mentioned earlier, you can’t use native compilation to reference both on-disk and memory-optimized tables – instead you must use interpreted TSQL, otherwise known as “interop”. In the next post we’ll discuss the requirements for using interop to reference both on-disk and memory-optimized tables within a single query.


Using temporal memory-optimized tables

The temporal feature works for both on-disk and memory-optimized tables, but has a slightly different implementation for memory-optimized tables.

As changes are made to rows in the temporal memory-optimized table, before being transferred to the history table on disk, they are first migrated to an internal memory-optimized staging table. That means when you query the “history table”, you could be retrieving rows from both the on-disk history table, and internal staging table. Because no custom indexing was possible on the internal staging table, there could be performance implications when executing queries against historical data. Microsoft addressed these potential performance issues in SQL 2016 SP1 (detailed in this CAT blog post).

The internal staging table only gets flushed to the on-disk history table when it reaches 8% of the size of the temporal table. Given the current capacities of Windows Server 2016 (24TB memory), it’s now possible to have very large memory-optimized tables. 8% of one of those large memory-optimized tables could be quite large, which will affect query performance, if predicates don’t match available indexes.

As of SP1 you can address the performance issues by adding (multiple) indexes to the internal staging table, and while that’s a fantastic improvement, there are some things to be aware of:

  • The fix requires Trace Flag 10316, so it’s one more thing you’ll have to remember to configure in your environments.
  • The name of the internal staging table is dynamic. This means that the script you maintain to recreate indexes on the internal table must first determine the name of the internal staging table (the CAT post details how to do this). And you’ll have the same issue for failover, whether it’s FCI or AG.

Now imagine you have dozens (or multiple dozens) of memory-optimized tables that use the temporal feature, and you want to customize indexing differently on all of them. The current SP1 solution doesn’t seem like such a great fix when DBAs must maintain dozens of scripts to apply custom indexing upon server reboot or failover.

There is perhaps a simpler solution, and that would be to monitor the number of rows in the internal staging table, and flush it to disk once it hits a threshold. Don’t assume that you’ll want to flush at the same threshold for all tables. And this won’t solve the custom indexing issue, but it could make queries perform less-worse until they’re flushed to the history table, where presumably you already have custom indexing in place. But again, you’ll have the dynamic table name issue.

You’d have to create a SQL Agent job that checks the rowcount for internal staging tables, and then call sys.sp_xtp_flush_temporal_history if required.

Your script would have to be intelligent enough to determine which tables are memory-optimized, and whether or not a given memory-optimized table uses the temporal feature.

And when you add/remove the temporal feature for a memory-optimized table, you’ll have to remember to update the custom script and Agent job. And of course this custom script will have to be executed upon reboot and/or failover.

This is just one more thing to be aware of when you consider deploying the temporal feature with In-Memory OLTP.

DML for memory-optimized tables in partitioned views

As part of a conversation on the #sqlhelp, I was giving feedback to a member of the Microsoft Tiger team about how In-Memory OLTP might be improved. One of my responses was about implementing a hot/cold data solution, and  Adam Machanic (b|t) responded, suggesting that partitioned views might work. I had already tested partitioned views and memory-optimized tables for queries, and confirmed that it worked as expected, but I had never tested DML for this combination of features.

Based on my new testing, I can state with confidence that partitioned view support for DML with memory-optimized tables will properly handle INSERT and DELETE operations, but some UPDATE operations might fail, and that failure occurs in a most ungraceful way. After verifying that this is an issue on SQL 2016 SP1/CU3 and SQL 2017 CTP2.1, I filed this Connect item. Microsoft has confirmed this issue, but has not yet determined how it will be fixed. For example, they could decide to disallow all UPDATEs when a memory-optimized table  belongs to a partitioned view, or instead decide to support it under limited circumstances. I’ll update this post when I have more detail from Microsoft.

Let’s assume that we have two tables that belong to a partitioned view. Both tables can be memory-optimized, or one table can be memory-optimized, and the other on-disk.

Success condition

an UPDATE occurs to a row in a table, and the UPDATE does not change where the row would reside, i.e. does not cause it to “move” to another table, based on defined CONSTRAINTS

Failure conditions:

   a. UPDATE occurs to a row in the memory-optimized table that causes it to move to either another memory-optimized table, or a on-disk table

   b. UPDATE occurs to a row in the on-disk table that causes it to move to the memory-optimized table

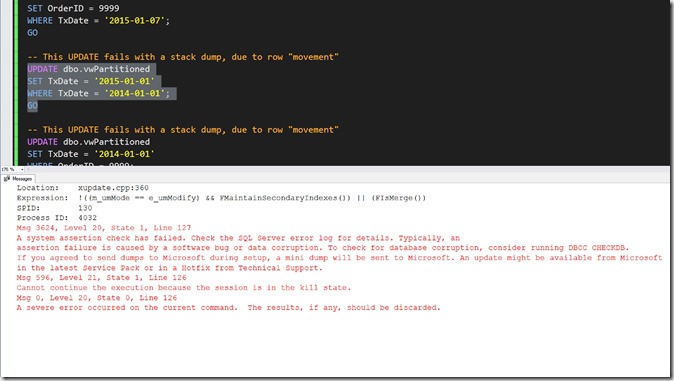
The failure looks like this:

PartitionedViewError

Repro script:

Which events cause durable memory-optimized data to be streamed to memory?

Those who have studied In-Memory OLTP are aware that in the event of “database restart”, durable memory-optimized data must be streamed from disk to memory. But that’s not the only time data must be streamed, and the complete set of events that cause this is not intuitive. To be clear, if your database had to stream data back to memory, that means all your memory-optimized data was cleared from memory. The amount of time it takes to do this depends on:

  • the amount of data that must be streamed
  • the number of indexes that must be rebuilt
  • the number of containers in the memory-optimized database, and how many volumes they’re spread across
  • how many indexes must be recreated (SQL 2017 has a much faster index rebuild process, see below)
  • the number of LOB columns
  • BUCKET count being properly configured for HASH indexes

The following list is for standalone SQL Server instances (under some circumstances, the streaming requirements are different between FCIs and AGs).

Database RESTORE – this is a no brainer – if you restore a database with durable memory-optimized data, of course your data must be streamed from disk into memory. And if you are under the impression that SQL Server verifies if your server has enough memory to complete the RESTORE, you would be mistaken. See my post here.

SQL Service restart in this case, all databases will go through the recovery process, and all memory-optimized databases will stream durable memory-optimized data to memory.

Server reboot – same as “SQL Service restart”

In addition to the list above, there are a few database settings that cause data to be streamed.

  • Changing a database from READ_ONLY to READ_WRITE, or from READ_WRITE to READ_ONLY
  • Setting READ_COMMITTED_SNAPSHOT OFF or ON
  • Taking a database OFFLINE and then ONLINE

A database that contains durable memory-optimized data will not be online until all memory-optimized data is finished streaming, which affects the availability of “traditional” tables (while a database is waiting for streaming to complete, the wait type is “WAIT_XTP_RECOVERY”). There’s nothing you can do to speed up the process, other than having initially defined enough containers on enough volumes, so that streaming executes in parallel.

SQL 2017 enhancements

Because modifications to HASH and NONCLUSTERED/RANGE indexes are not logged for memory-optimized tables, they must be rebuilt when data is streamed to memory. Both SQL 2014 and SQL 2016 have a limit of 8 NONCLUSTERED indexes per memory-optimized table (any combination of HASH and RANGE). Microsoft has designed a new process for enhancing index rebuild speed in SQL 2017. This dovetails perfectly with the removal of the 8-indexes-per-table limit in SQL 2017 (I have personally created a table with 298 NONCLUSTERED indexes in SQL 2017).

Migrating tables to In-Memory OLTP

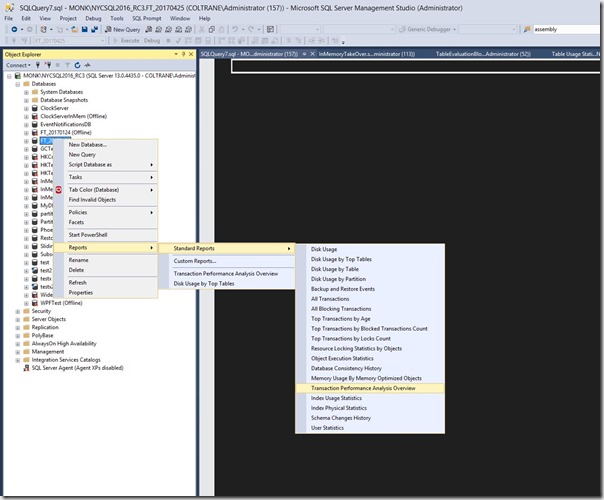
One of the first things you might do when considering migrating a table to In-Memory OLTP, is to run the “Transaction Performance Analysis Overview” report:
BlogTPAO

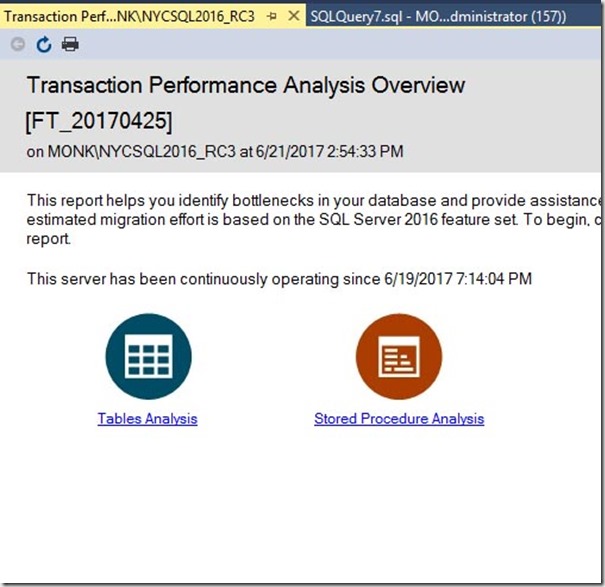
Then you arrive at the following window:
BlogTPAnalysis

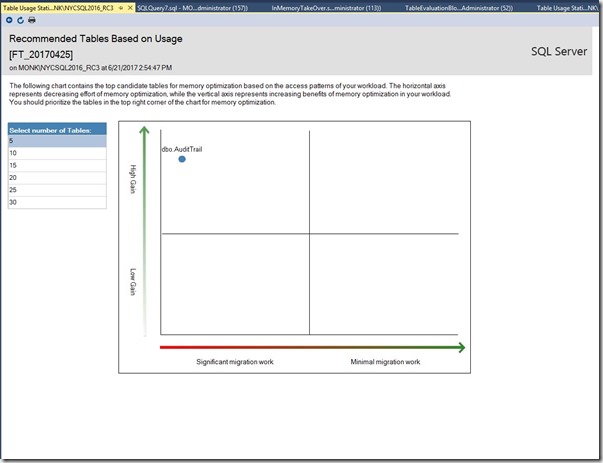
If you click on “Tables Analysis”, a sort of “magic quadrant” appears:
BlogQuadrant

The chart attempts to display both the best candidates and the degree of difficulty for migration. But there are a few problems with the “difficulty” rating of this internal query, and as a result, if we really want to know how easy/difficult the process might be, we’ll have to roll our own query.

The original query counts the following conditions (the list is out of order on purpose):

nullable columns
LOB data types, i.e. NVARCHAR(MAX)
unique indexes/constraints
default constraints
check constraints
UDT
foreign keys
triggers
index with type > 2
computed columns
sparse columns
IDENTITY <> 1, 1
assembly
unsupported data types, i.e. DATETIMEOFFSET
filestream columns

Some of those conditions are 100% supported in SQL 2016, without any issue, while others have variable levels of migration difficulty, and still others are not supported at all. But even if we remove the items that are completely supported, all of the remaining items have the same weight. That could be pretty misleading, and might cause you to rule out migrating a table to In-Memory that could potentially be an excellent candidate.

Now let’s look at the list in another way:

**************************
supported without any issues
**************************
nullable columns
LOB data types, i.e NVARCHAR(MAX)
unique indexes/constraints

**********************************************************************
supported with a range of migration difficulty (from no difficulty to very difficult)
**********************************************************************
default constraints
check constraints
UDT
foreign keys
triggers

index with type > 2
0 = Heap
1 = Clustered
2 = Nonclustered
3 = XML
4 = Spatial
5 = Clustered columnstore index
6 = Nonclustered columnstore index
7 = Nonclustered hash index

********************
unsupported/blocking
********************
computed columns
sparse columns
IDENTITY <> 1, 1
assembly
unsupported data types, i.e. DATETIMEOFFSET
filestream columns

My version of the script removes the checks for nullable and LOB columns, and also for UNIQUE indexes/constraints.

And for the remaining conditions, since they’re all weighted the same by virtue of counting them, I wanted to place them in different buckets. After running my script on a sample database, I can see that the AuditTrail table has the following potential migration “issues”:

BlogIssues

There are a total of 8 issues, although migrating default constraints, user-defined data types, and LOB columns will be easy. It’s the foreign keys that might prove difficult, potentially leading to a long chain of tables that would have to be migrated (because foreign key constraints on a memory-optimized table can only reference other memory-optimized tables).

We definitely have a much clearer picture of the potential migration difficulties. With this version of the script, you can make informed choices about which tables you might want to migrate to In-Memory OLTP.

Also note that computed columns are supported in SQL 2017, so this script could have some intelligence added to allow for that.

SQL Server specialization: the journey

I am a self-proclaimed In-Memory OLTP Evangelist, dispelling myths and misconceptions as I preach.

Some folks might be interested in how I got here . . .

I’ve been a production SQL Server DBA for more than two decades, but throughout almost all of that time, I have not concentrated on a specific area of SQL Server – I was a “generalist”.

Around 2011, I became aware of SQL MCM Brent Ozar (b | t) , and was inspired by his dedication to the SQL Server community. One piece of advice he has stressed repeatedly, is that you must be known as a person that can relieve a specific type of pain – you must specialize. However, even with the release of SQL 2012, I didn’t latch onto anything specific.

When SQL 2014 arrived, I became fascinated with In-Memory OLTP. I studied its inner workings, probed and poked it, but became disillusioned with its extremely narrow set of use cases, so I put it down.

When I received the early CTPs of SQL 2016, I could see that things were changing for In-Memory OLTP. Most of the issues with the 2014 release were addressed, and it was integrated with new features. I became fully committed to learning everything about it – I read white papers, blogs, books, forum posts, and every page of the documentation on In-Memory OLTP for SQL 2016.

After a while, I felt ready to present to the local user group about In-Memory OLTP.

Presentation itself is an art form, and again I must mention Brent, as it’s an area of keen interest for him (many posts on his personal blog are about presentation).

In May of 2016 I was fortunate enough to connect with SQL MCM Edwin Sarmiento (b | t), who has profound SQL Server and presentation skills. Edwin pointed me to one of his online slide decks that listed presentation resources (you can see the slide deck here, and he gives excellent advice about mastering a new SQL Server feature here).

I knew my presentation skills could be improved, so I studied and practiced presenting, and when I felt I was ready, I started applying to SQL Saturdays.

The advice I received from my mentors has proven to be true – if you really want to learn something, you must teach it. Even the act of preparing educational materials makes you think like an attendee, and helps you distill the essence of what you are trying to communicate.

Timing is everything

Towards the end of 2016, I had not seen wide adoption of In-Memory OLTP. Then on November 16th, Microsoft issued a blockbuster announcement: as of Service Pack 1 for SQL 2016, In-Memory (and other formerly Enterprise-only features) would be available in non-Enterprise editions. As a result, there seems to be a lot more interest in this feature, and I’m really excited about that.

To the blogosphere

After working with the SQL 2016 CTP releases for a few months, I started blogging about In-Memory, but I didn’t want to repeat what others had already written about it. I had read dozens and dozens of blog posts, and 99% of them fell into one of two categories: internals and speed comparison. Instead, my focus was about the various ways in which deploying In-Memory can affect the database environment, from restoring databases to database architecture, and how it works with other features, such as Availability Groups and Replication, and how to troubleshoot it. I also blogged about the inevitable “gotchas” that come with adoption of any new feature.

If a question about In-Memory pops up on Stack Exchange, MSDN forums, or #sqlhelp on Twitter, I try to help. I remember how difficult it was for me in the beginning, mostly because the documentation hadn’t yet been updated for SQL 2016.

“Jaw on floor…”

I was recently contacted by SQL MCM Robert Davis (b | t), who asked if I might be interested in joining his team (I was honored to be considered). I’ve been following Robert a long time, and have learned a lot from reading his blog and attending his presentations.

My reply began with: “jaw on floor…”

I have no idea if I’ll end up joining Robert’s team, but that’s not the point.

The real point is – my efforts to specialize have paid multiple dividends, and one of them is being recognized as a technologist having deep expertise within the In-Memory OLTP space. For the last eighteen months, I’ve had a feeling that I’m on a path that’s right for me.

My journey was set in motion by a variety of factors:

  • inspiration from members of the SQL Server community
  • a genuine desire to help others
  • having an open mind
  • extreme personal motivation
  • following my intuition

I’m writing this post so that others might draw inspiration from it – just one more way to give back.

Ned Otter

New York City, June 2017

Availability Groups and Native Compilation

For disk-based tables, query plans for interpreted/traditional stored procedures will be recompiled when statistics have changed. That’s because when you update statistics, cached query plans for interpreted stored procedures are invalidated, and will automatically recompile the next time they’re executed. That’s true for an interpreted stored procedure that references disk-based tables, and/or memory-optimized tables.

As of SQL 2016, the database engine automatically updates statistics for memory-optimized tables (documentation here), but recompilation of native modules must still be performed manually. But hey, that’s way better than SQL 2014, when you couldn’t recompile at all; you had to drop/recreate the native module. And natively compiled stored procedures don’t reside in the plan cache, because they are executed directly by the database engine.

This post attempts to determine if the requirement to manually recompile native modules is any different for AG secondary replicas.

Stats on the primary

Statistics that are updated on the primary replica will eventually make their way to all secondary replicas. This blog post by Sunil Agarwal details what happens on the secondary replica if the statistics are stale (relative to any temporary statistics that were created on the secondary).

How do we…?

The first question we must answer is: how do you determine when the last time a natively compiled stored procedure was compiled?

We can do that by checking the value of the cached_time column from the following query:

The query is simple, but you won’t get any results unless you enable the collection of stored procedure execution statistics for natively compiled procedures. Execution statistics can be collected at the object level or instance level.

NOTE: Enabling the collection of stored procedure statistics for natively compiled procedures can crush your server, potentially resulting in disastrous performance impact. You must be extremely careful with this method of troubleshooting.

Once you’ve enabled stats collection for native procedures, you should get results from the query above.

How I tested

Here are the steps I executed, after creating an AG that used synchronous mode (containing a single database with a memory-optimized filegroup):

  1. Create a sample table
  2. Insert some rows
  3. Create a natively compiled procedure that selects from the sample table
  4. Execute the native procedure on the primary and secondary (it must be executed at least once in order to have usage stats collected)
  5. Enable collection of stored procedure execution statistics on the primary and secondary replicas
  6. Again execute the native procedure on the primary and secondary
  7. Note the value of sys.dm_exec_procedure_stats.cached_time on the primary and secondary
  8. Recompile the native procedure on the primary
  9. Execute the native procedure on the primary and secondary
  10. Again note the value of sys.dm_exec_procedure_stats.cached_time on the primary and secondary

Results

The cached_time value on the secondary did not get updated when the native module was recompiled on the primary.

What does this mean for DBAs that are responsible for maintaining AGs that use native compilation?  It means that when you recompile native modules on the primary replica (which you would always do after updating statistics on the primary), those modules must be recompiled on all secondary replicas. The recompilation on the secondary can be performed manually or perhaps through some automated mechanism. For example, if you have a SQL Agent job on the primary replica to update statistics, one of the job steps might be for marking all natively compiled stored procedures on the secondary for recompilation, using sp_recompile.

How would that job step handle the recompile for all secondary replicas?

Perhaps after defining linked servers, you could do something like:

EXEC SecondaryServer1.msdb.dbo.sp_start_job @job_name = N’Recompile native procs’;

EXEC SecondaryServer2.msdb.dbo.sp_start_job @job_name = N’Recompile native procs’;

But it might be involved to define this for all secondary replicas – it sounds like a topic for another post…..

Happy recompiling –

How NOT to benchmark In-Memory OLTP

In forums over the last few months, I’ve seen a number of posts like the following:

  • “I tested native compilation, and it’s not much faster than using interpreted TSQL”
  • “I’m seeing performance issues with memory-optimized tables”

Tools and latency

Sometimes the bottleneck is the tool that’s used for testing. One person was using Ostress.exe and logging output to a file, using the –o parameter. This caused the benchmark they ran for memory-optimized tables to actually perform worse than disk-based tables! The overhead of logging Ostress output to disk created a high degree of latency, but once they removed the –o parameter, In-Memory OLTP performed super-fast for their workload.

Across the wire

Client/server messaging has overhead, and this cannot be improved by using In-Memory OLTP. Whether you’re returning one million rows from a disk-based table or a memory-optimized table, you’re still sending one million rows across the wire, which is not a valid test of In-Memory OLTP performance.

Core count

When you do a proof of concept, you should keep in mind that In-Memory OLTP is designed to work with many cores, and many concurrent processes. If you do your POC on a laptop with a single-threaded workload, In-Memory OLTP is not likely to deliver orders-of-magnitude performance benefits.

Simple queries used for testing Native Compilation

If you test with a query like:

SELECT col1
FROM table1


then native compilation will probably not be much faster than disk-based tables. Native compilation will show the greatest benefit when encapsulating complex business logic.

“Test” workloads

Doing a proof of concept with a contrived workload will not accurately determine if your real workload would benefit from migrating some or all data to In-Memory OLTP. The best way to do a proof of concept would be to use a copy of your production database with a realistic workload. You could run against disk-based tables first, and after migrating data to In-Memory, you could re-run and compare the results.

Deploying In-Memory OLTP can increase workload performance in several ways:

  • latch/lock free architecture
  • reduced/enhanced logging – modifications to indexes are not logged, and also the entire logging process has been redesigned for memory-optimized tables
  • interpreted TSQL overhead
  • temp table/tempdb overhead
  • excessive computation

Obviously you’d need to have a reasonable amount of concurrent activity in order to determine if In-Memory OLTP would achieve performance gains for your workload.

Monitoring In-Memory OLTP Resource Pools

For databases that contain memory-optimized data, it’s considered a best practice to create a separate resource pool that limits memory consumption for memory-optimized objects. If you don’t use use Resource Governor to constrain the amount of memory allocated to memory-optimized objects, it’s possible that the buffer pool will respond to memory pressure, shrink, and performance for traditional/on-disk tables will be impacted (using Resource Governor also allows you to track memory consumption specific to that database). We must carefully monitor the amount of memory used by the resource pool, and respond when it goes beyond a certain threshold. If we don’t, then we can reach an out-of-memory condition (OOM).

This blog post details the various approaches I considered.

Option 1

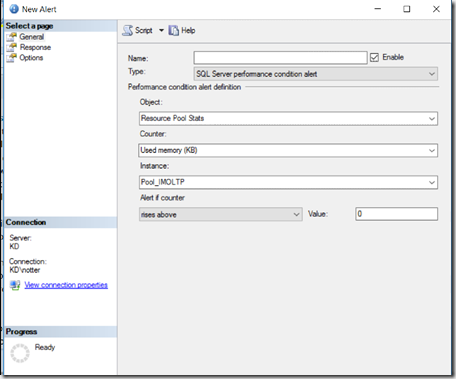
SQL Agent Performance Condition Alerts can respond to changes on the “Resource Pool Stats” object. This gets us pretty close to the stated goal, but unfortunately you have to hard code a threshold value for “Used memory (KB)”. If you needed to deploy this type of monitoring on many servers, and over time some of them upgrade physical memory, you have to remember to go back and adjust the hard-coded value for the new threshold. I was hoping to be able to evaluate this as a percentage of “Target Memory (KB)”, and then alert above x%, but that doesn’t seem to be possible with Performance Condition Alerts.

image

Option 2

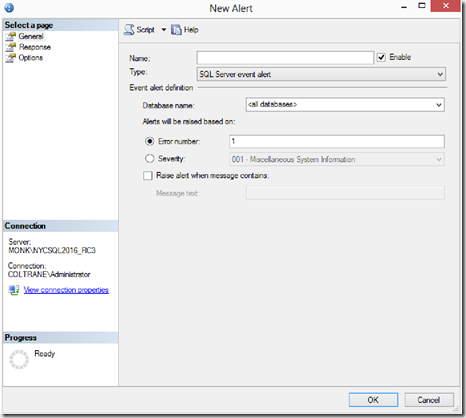
SQL Server Event Alerts can take action when a specific error number occurs. I checked sys.sysmessages for references to the word ‘pool’, but as far as I can tell, none of them allow you to proactively respond to memory conditions before you run out of memory. We have errors like:

  • Disallowing page allocations for database ‘%.*ls’ due to insufficient memory in the resource pool ‘%ls’.
  • There is insufficient memory in the resource pool ‘%ls’ to run this operation on memory-optimized tables.
  • There is insufficient system memory in resource pool ‘%ls’ to run this query.

image

Option 3

Another possibility would be to have a TSQL Agent job that constantly polls sys.dm_os_performance_counters:

This would allow you to calculate the ratio you want to alert on, and then send an email. I like this approach for its simplicity, but you’d have to compare the value of cntr_value for two different rows to calculate the percentage.

Option 4

I looked into WMI, and the documentation is pretty bad about exactly what’s supported for SQL Server. I was surprised to find that the class I needed was part of root\cimv2, not in the SQL Server branch. Note that there can be security issues with accessing WMI, so that might be a concern for your environment (NOTE: WMI is pretty old, so it’s not recommended to keep using it. Instead, we should CIM, Common Information Model).

This does exactly what we need:

No matter how much memory is assigned to the pool, it calculates the percentage that’s used. If the value of Used memory exceeds a pre-defined percentage of Target memory, you might send an email, write to the SQL Errorlog (and then notify based on that error number), or use other options for logging and notification.